New release – Q2-2024 Mobile metrics for U.S. major shopping centers and malls
The latest release of trade area analysis for the DMM major shopping centers and malls in the U.S. is now available on ShoppingCenters.com and via custom dataset licensing options
Top 5 recurring PRIZM segments across the DMM dataset 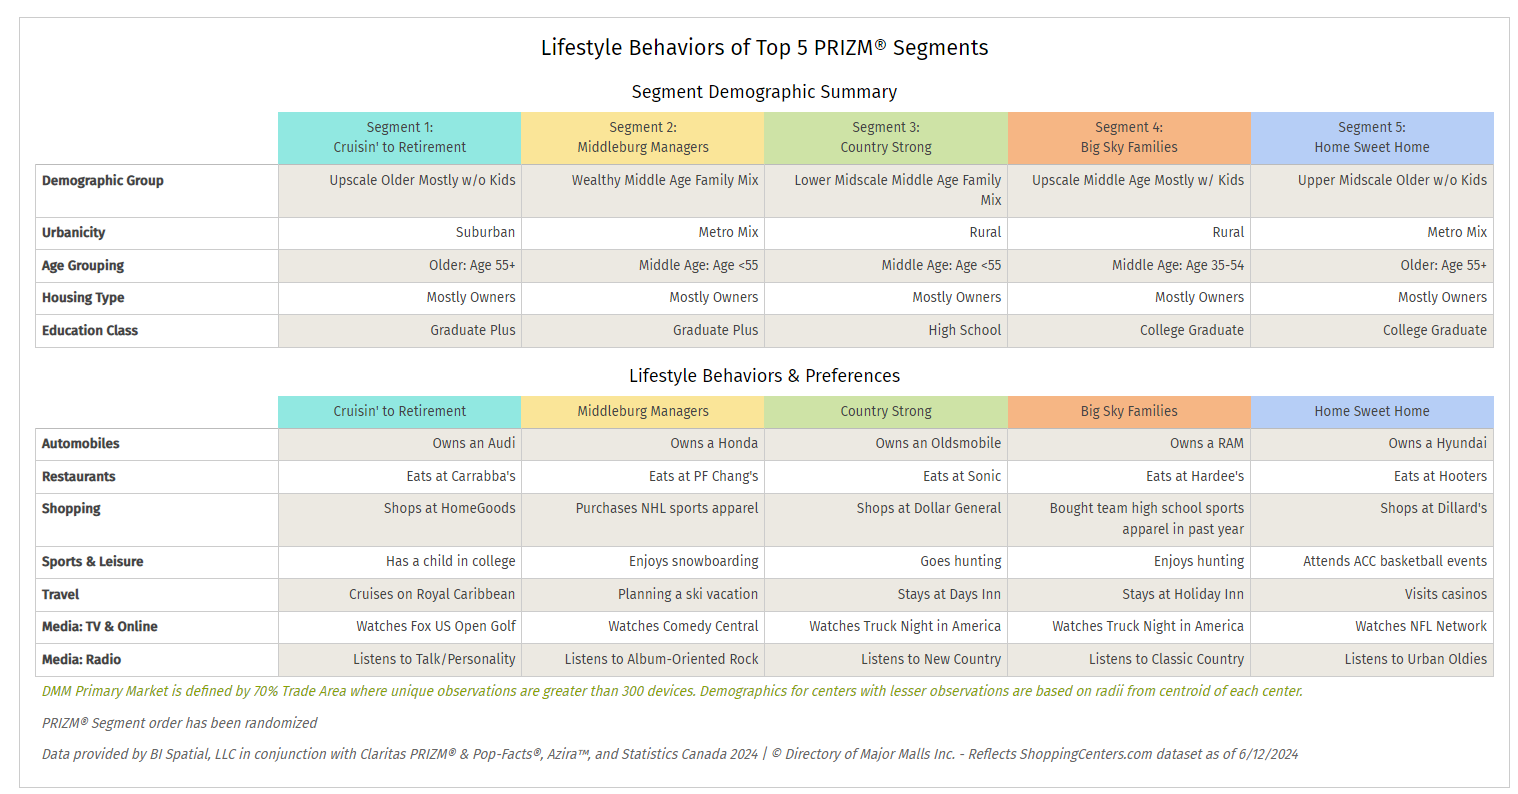
# of properties per segment
- Middleburg Managers : 2,547
- Cruisin’ to Retirement : 2,539
- Country Squires: 2,534
- Country Strong: 1,988
- Big Sky Families: 1,885
Additional highlights include:
📈 Top 10 increases for mobile activity by Qtr: 71% to 199%
Nine (9) are open-air centers with an average GLA of 524,079 sqft
📉 Biggest decrease in mobile activity by Qtr: -28% to -25%
🚗 Average Miles Traveled to a property: 11.35 miles
🏬 Cross-Shopping Reporting : Highest this quarter: 31% Unique Visitors and 49% Visiting Both centers
Additional update mobile data variables include:
- Cross-Shopping Reporting
- Top 5 Cross-Shopped Centers with center types and distances
- Nearest Competing Center and e
- Nearest Comparable Center w. distance
- Nearest Competing and Comparable sh ctrs
- Area Visitation Metrics:
- Tourism % and distances
- Average Distance Traveled (multiple variables)
- Nearest Competing Center w. distance
- Nearest Comparable Center w. distance
- Top 5 Visitor Segment distance
- Avg. Miles Traveled by Visitors to the property
o By Center Classification
o By Center Type
o By Region
o By Top 10 Landlords
- Anchor Store Status and GLA Metrics
- Total Anchor GLA
- Total Closed/Vacant Anchor GLA
- % of Total GLA with Closed/Vacant Status
- Owner Portfolio GLA metrics
- Filter to identify and Locate Closed/Vacant Anchors
Tenant Lists- Categorized Tenant Lists (16 Categories)
- Retail Chain Type Metrics (National, Regional, Independent)
…and more
Sample Mobile Visitor Metrics and PRIZM Segments 
Sample cross-shopping reporting

Keep Reading about DMM’s mobile metrics, enhanced trade area analysis, demographics and segmentation variables (partnership sources include: Claritas, PRIZM, Azira mobile data and BI Spatial).
Access these “Ready Made Results” quickly and easily to achieve these results
- Identify potentially distresses properties ripe for acquisition of redevelopment
- Focus on which centers compete by visitor traffic and center classification
- Understand target consumers activity and behavior more succinctly
- Making faster decision. Focus Your Efforts
Reference materials:
- Trade Area Visitation and Cross-Shopping Definitions
- Retail Traffic & Consumer Behaviors – REALITY vs Rings
- Retail Planning and Broker Analytics
- Mobile Traffic, Segmentation and Enhanced Demographics feature
- BI Spatial – Precision with Privacy
Related articles:
- How Directory of Major Malls used Azira and B I Spatial to Achieve More Precise Shopper Insights
- Target Market Voids – Outperform & Outpace The Competition – DMM Data Technology Integrations