by: Andy Moncla, Chief Operating Officer, B.I. Spatial
 What’s a Trade Area?
According to Webster a trade area is “a geographic area within which a business enterprise or center of retail or wholesale distribution draws most of its business.” With many retailers “most” is 70%, which equates to a primary trade area. A secondary trade area is typically 90%.
Trade Area Techniques: Rules or Reality?
As an Alteryx user I have been a fan of the drive time engine and was an early adopter of drive time-based trade areas. The drive time’s advantage over radius-based trade areas is obvious. The expression “you can’t get there from here” sums up the problems with using a radius. When delineating the store’s trade area, which should we use?
Rules
I’ve never really liked rules. In fact, I hate rules that don’t make sense – to me. If you’ve ever been at a red light, with no other traffic in sight, you’ve probably wondered if waiting on the red light was really necessary. In my mind rules are often more like suggestions.
The same is true with trade area rules. The rules may make sense – until you see the radius or drive time keeps going on and on in a direction that you know it shouldn’t.
Reality
I prefer the reality provided by customer spotting data. I’m not going to argue the validity or skew of loyalty programs, customer intercept studies or credit card-based customer location data.
Considerations
It is always better to delineate your trade areas based on customer data. Some analysts simply base the trade areas on the percent of customers captured. Others, if value or spend is attached to the customers, prefer the percent of spend captured. Both have their merits, but the value of customer-based trade areas can easily be diluted by poor techniques.
Even more problematic is when there is no customer data. In these situations retailers typically use radii or drive times. More sophisticated researchers will employ population or household density rules to shrink or expand the extent of the trade areas. Rural trade areas will be larger and urban trade areas will be smaller. For now, let’s pretend that competition, sister stores and commuting patterns aren’t a concern.
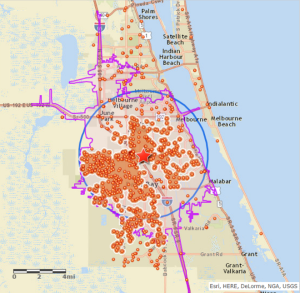
“Case Study”
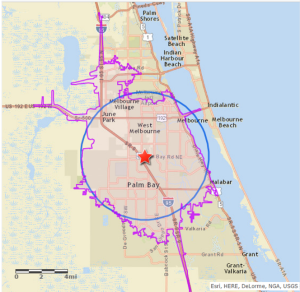
The image to the right is of a store in Palm Bay, FL with a 5 mile radius and a 15 minute drive time. On the surface both trade areas cover most of the market. Demographically, the household incomes are within $5,000 and the ethnic/racial distributions are very close. Which trade area should an analyst use? Did the drive time go too far? Did the radius go far enough? The better question is probably “Is either trade area correct?”
Customer Data
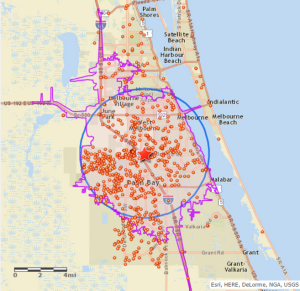
Customer data affords a reality-based view(s) of the trade area. As you see, neither the radius or drive time accounts for customers due south. For the record, “dot” maps can be very misleading as your eye might be drawn to an area that only appears to be important.
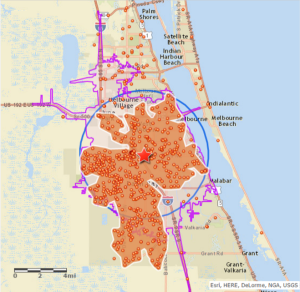
Convex Hull Method
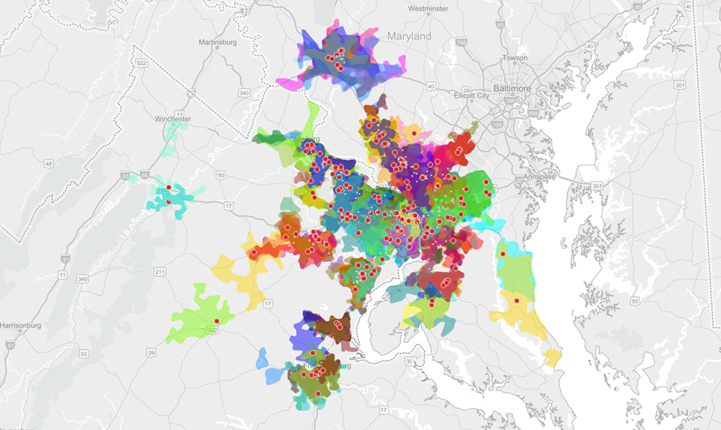
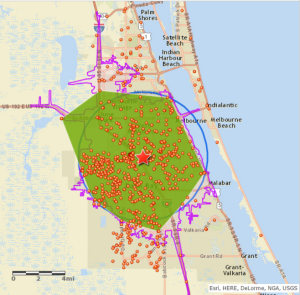
This method simply wraps a polygon around the outermost points. In the example below, I’ve selected the nearest 70% of the customers and then employed the convex hull tool within Alteryx. Adhering to the rule of capturing the nearest 70% elongates the trade area to the northwest while missing the area due south. The problem with this rule-based method is that single points can distort the trade area reality.
Customer Buffer Method
This method applies a minimal buffer around every customer point. The buffers are combined and then split into individual “blobs” using the Poly-Split tool in Alteryx. Customers are captured by the individual polygons and the count, or share, of customers within each allows for a contribution-based selection. The result may be the best solution, compared to the other techniques, but its atypical shape is difficult for some to accept.
Nearest Neighbor Method
Like the Customer Buffer method, this method searches for groups of customers. This method was inspired by the TIN (triangulation Irregular network) method commonly used in the calculation of contour mapping. Unlike the TIN, this method may use up to 8 (all cardinal directions) neighbors, not just 3. This is a complex model within Alteryx. It incorporates a macro within an iterative (goal seeking) macro. The imbedded macro searches for neighbors based on distance. The distance within the macro is increased by the iterative macro until the resulting trade achieves the capture rate, or goal.
Results
As you might suspect, there is considerable overlap in the results. The figures below refer to area households, not customers.
- The 15 Minute Drive Time contains 17% more households than the 5 Mile Radius.
- 99% of the 5 Mile Radius households are within 15 minutes.
Both methods capture the lion’s share of the customers: 77% within 15 minutes and 72% within 5 miles. The problem is the inclusion of areas/populations that aren’t part of the trade area.
Of the Customer-based methods,
- 99% of the Customer Radius households are also Nearest Neighbor households, but since the Customer Radius produces a very precise, but disjointed trade area, it has 34% fewer households
- About 90% of the Nearest Neighbor households are also Convex Hull households
The Convex Hull and Nearest Neighbor methods have a lot of overlap. Is it important to understand the difference between the two exclusive areas? Probably. For example, the median age difference between the two exclusive areas is almost 9 years and the projected household growth rate is 4 times as high in the younger areas. If these two factors are important to your business, the precision is worth it.
Conclusion
This was intended to be very high level, but in-depth enough to get you thinking. Different methods produce different results, so take the time to explore the different methods.
As Joe Rando stated on his blog “If you build your model using data that is wrong, your model will be wrong.” (http://blog.tradeareasystems.com/blog/everything)
Thanks for taking the time to read this.
About the Author:

ANDY MONCLA, COO of B.I. Spatial
Andy is a leading Business Geographer with more than 18 years experience in a variety of industries, including retail, banking and information technology. His experience includes expansion planning, market analyses, site selection, market gap/penetration analyses, and customer segmentation analyses. He was Market Research Manager at both Lowe’s Home Centers and RBC Centura Bank, and is currently the Chief Operating Officer at B. I. Spatial, and has been using Alteryx, (a data analytics platform for businesses) for more than 10 years to help his clients blend data, perform spatial modeling, and generate sophisticated reports.
Andy earned a Bachelor of Arts degree in history from East Carolina University, and an MA in Geography, with an applied focus, from East Carolina University.
For more information on Andy and to contact him: B.I. Spatial