What are the demographics, segmentation and mobile analytics available for the shopping center and mall listings?
There is plenty of it. As you upgrade your subscription access level, demographic attributes, mobile analytics and segmentation data expands.
Primary Market and Trade Area Demographics include:
- Population of Primary Market
- Number of Households
- Average Household Income
- Median Age
- Median Household Income
- Average Age
- Nielsen Designated Market Area
- Census Regions
- Trade Area Map
- Population & Household Breakdowns
- Income: Average & Median
- Household Units: Owners & Renters %
- Gender %
- Age %
- Ethnicity Indices
- Education %
- 5 Year Forecasted Trends
Mobile Analytics and Segmentation Data include:
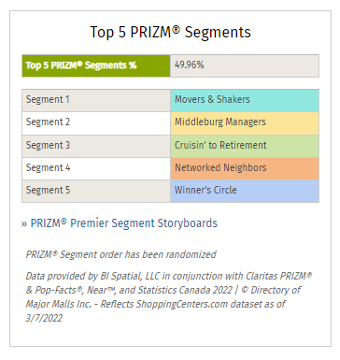
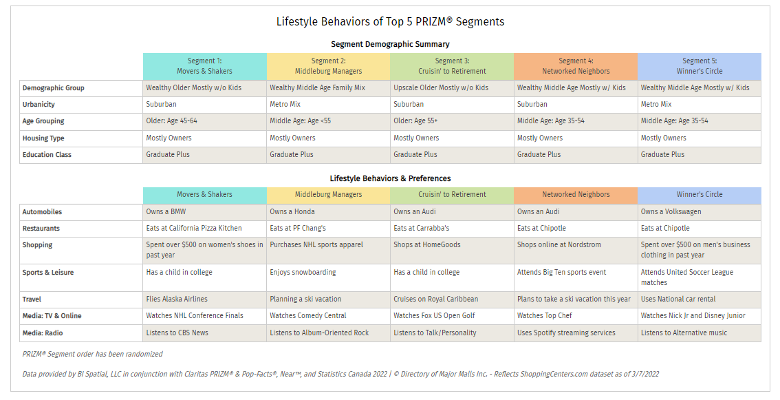
- Top 5 PRIZM® Segments
- PRIZM® Lifestyle Behaviors & Preferences
- Mobile Observations – Rolling 12 Months
- Tourism Observations % by Visit and Devices
- Forecasted Pop. Growth %
- Median Income (Graphed in comparison to Average)
- Population by Gender – Male % vs Female %
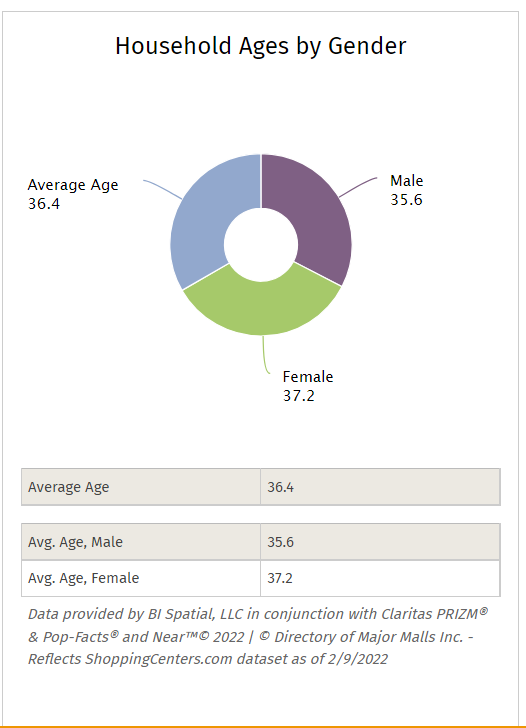
- Household Ages by Gender – Male vs Female
- Avg. Household Size
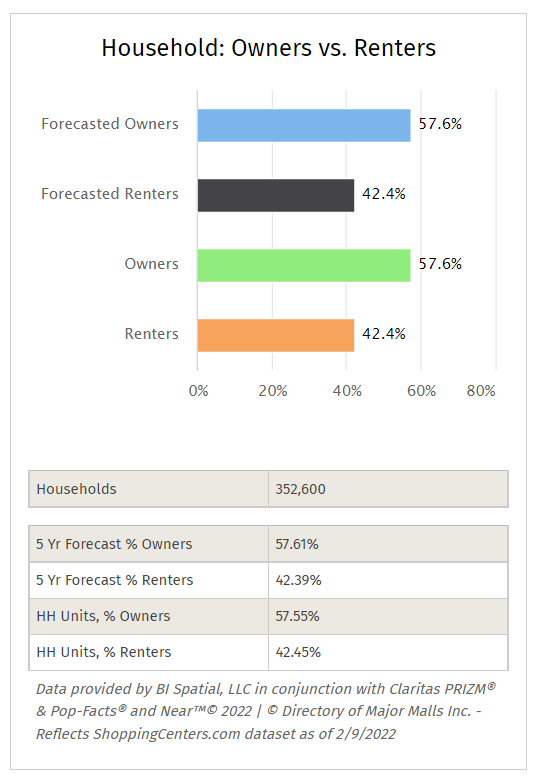
- 5 yr Forecast: % Owners vs. Renters
- Household Units: % Owners vs Renters
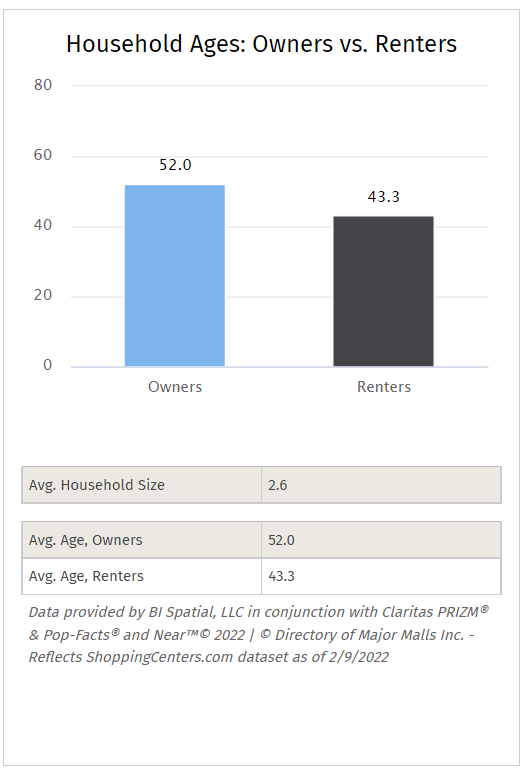
- Household Ages: Avg Age Owners vs Renters
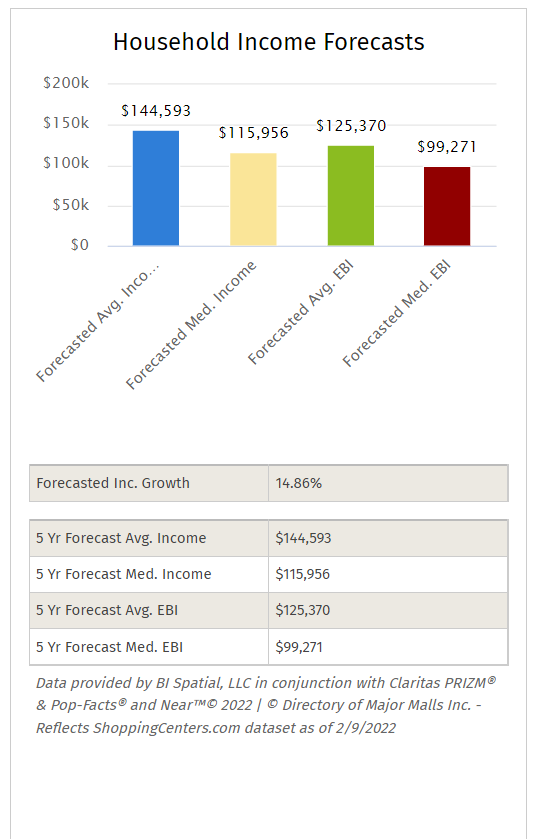
- Household Income Forecasts
- 5 Yr Forecast Avg. Income
- 5 Yr Forecast Med. Income
- 5 Yr Forecast Avg. EBI
- 5 Yr Forecast Med. EBI
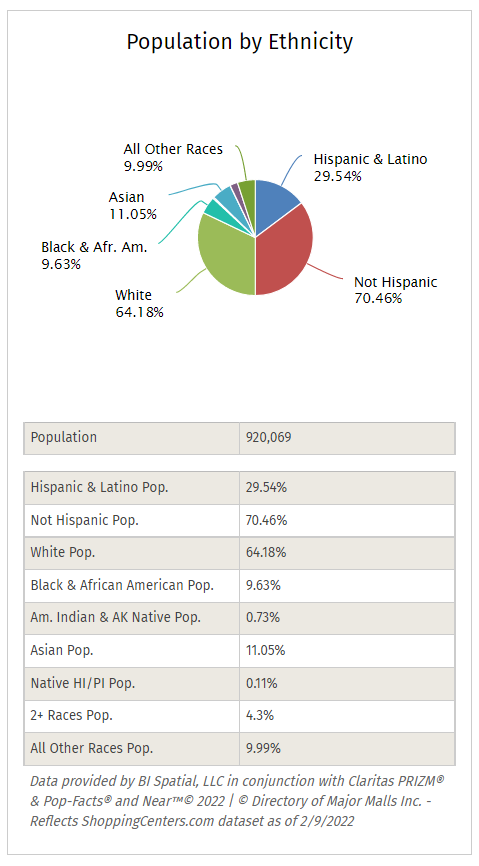
- Population by Ethnicity
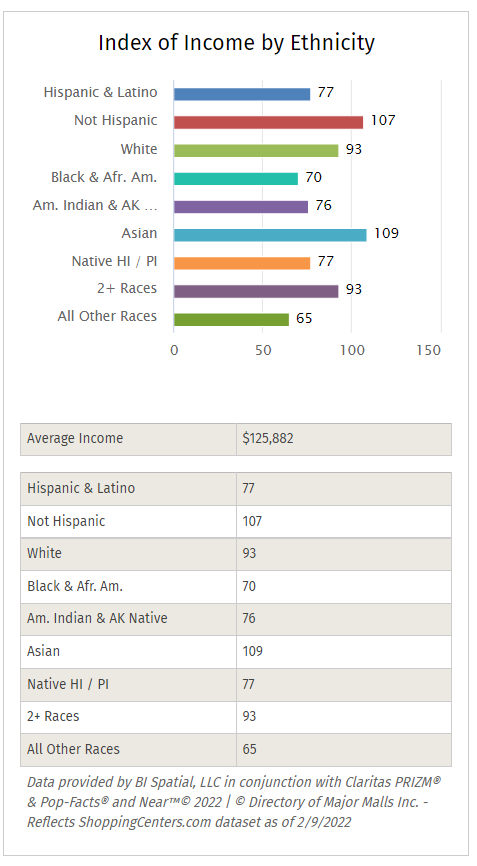
- Index of Income by Ethnicity
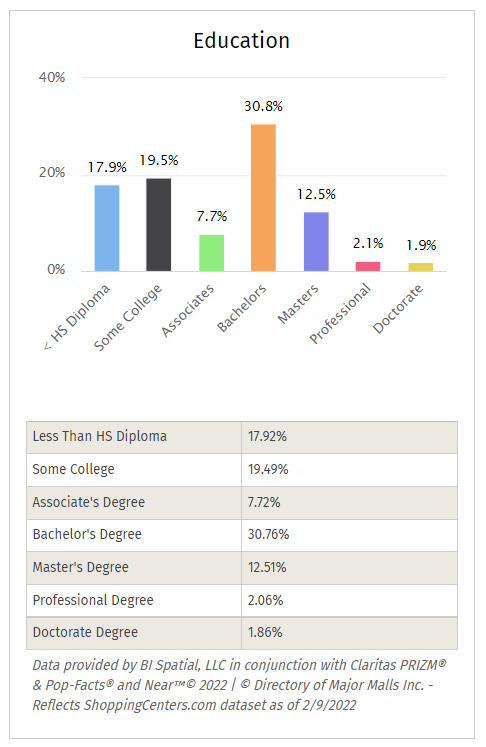
- Education
Here’s the Breakdown by Subscription Tier
At the CLASSIC Level, total figures are available:
Primary Market Tab:

Upgrade to the ENHANCED level:
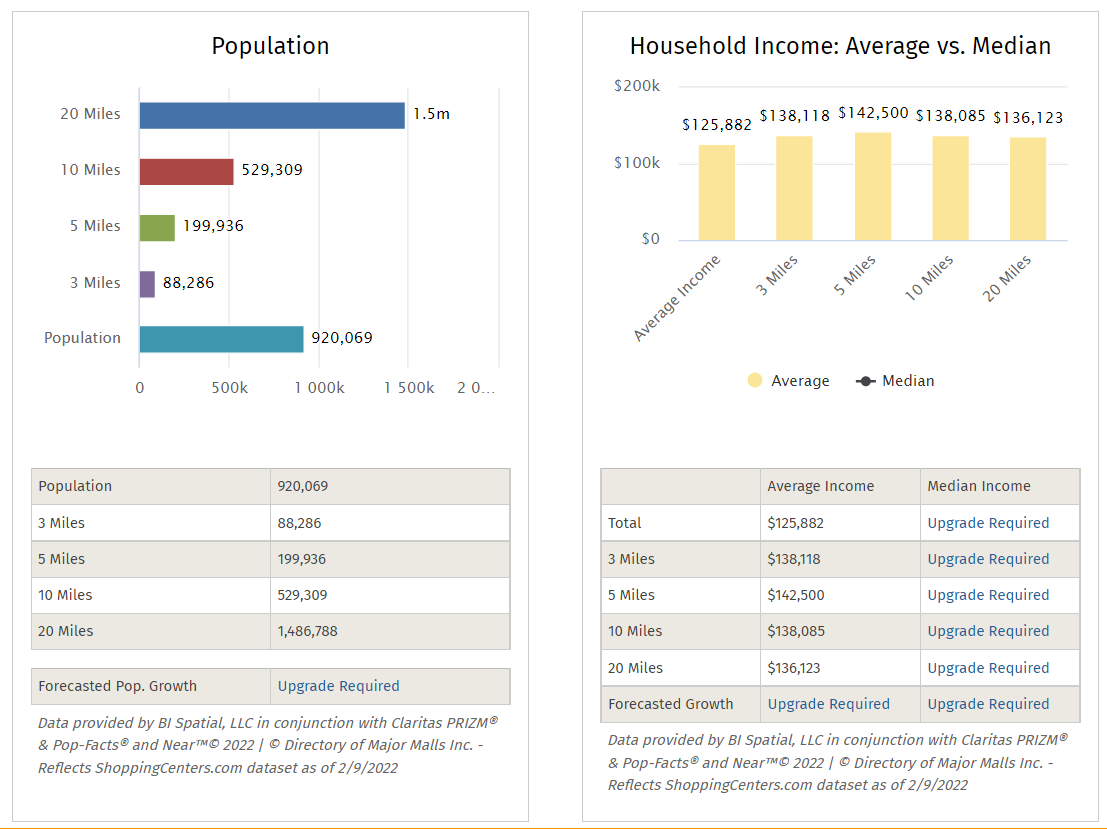
- Primary Market Tab – further details for 3, 5, 10 and 20-mile radius rings are unlocked
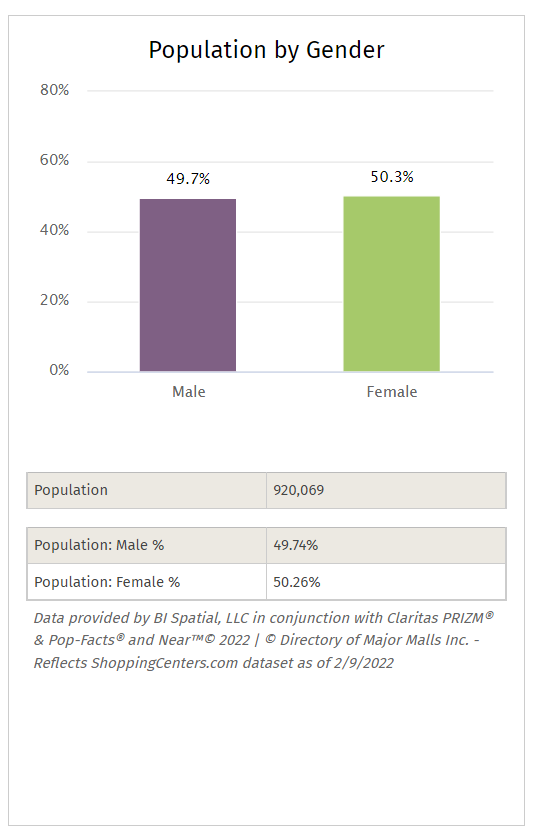
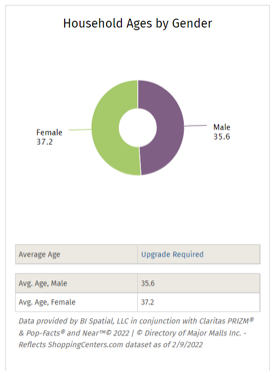
- Mobile Analytics Tab – reveals graphs reflecting:
- Population
- Average Household Income
- Population by Gender
- Households Ages by Gender
Primary Market Tab:

Mobile Analytics Tab:
Upgrade one more level to PREMIUM and additional attributes are revealed:
- Primary Market Tab – expands to include:
- Median Household Income
- Average Age
- further details for 3, 5, 10 and 20-mile radius rings are unlocked
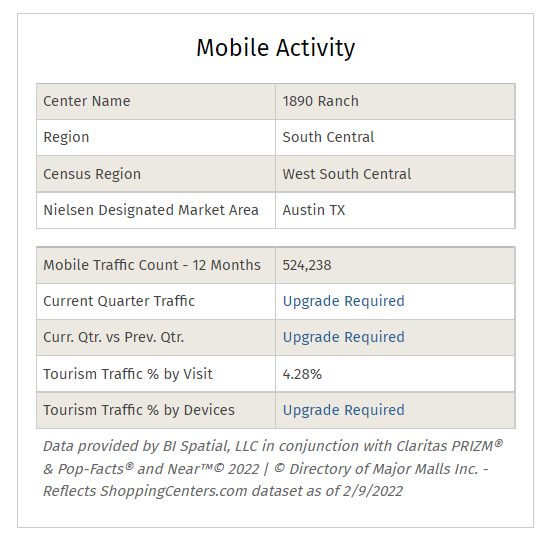
- Mobile Analytics Tab – expands to include:
- % of Top 5 PRIZM® Segments
- Mobile Observations – Rolling 12 Months
- Tourism Observations % by Visit and Devices
- Forecasted Pop. Growth %
- Median Income (Graphed in comparison to Average)
- Population by Gender – Male % vs Female %
- Household Ages by Gender – Male vs Female
- Avg. Household Size
Primary Market Tab:

Mobile Analytics Tab:
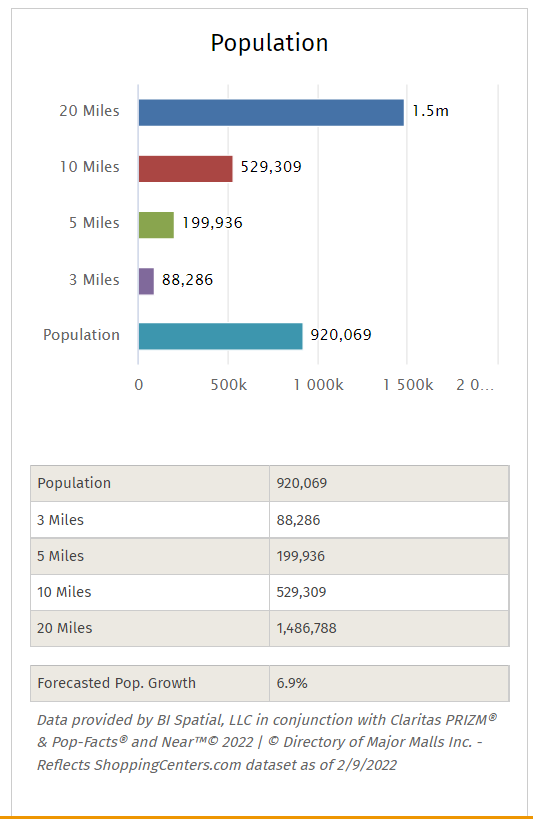
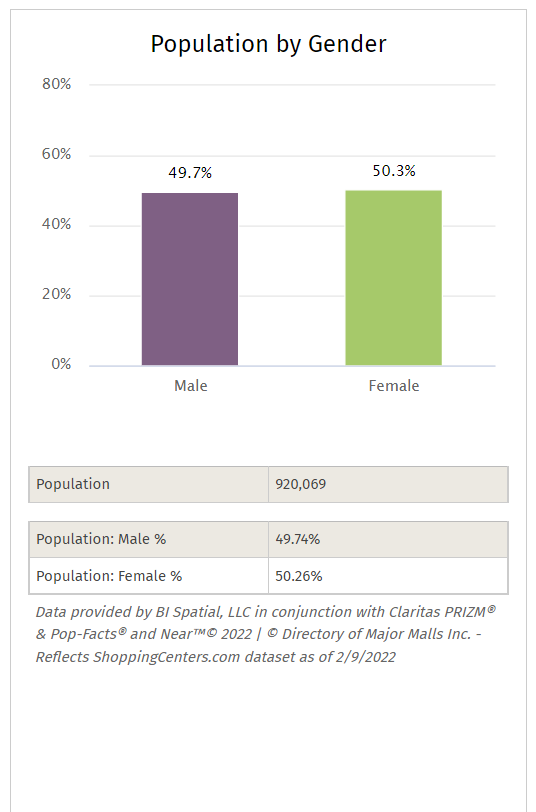
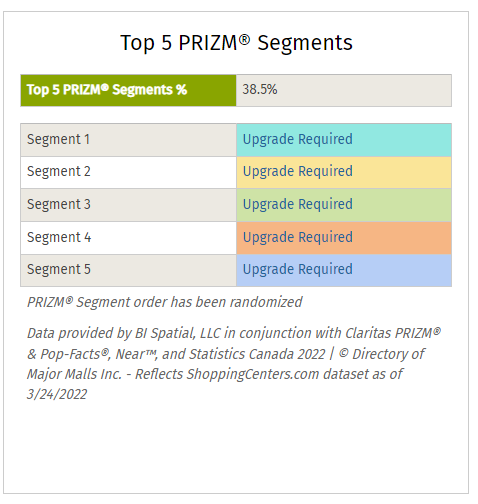
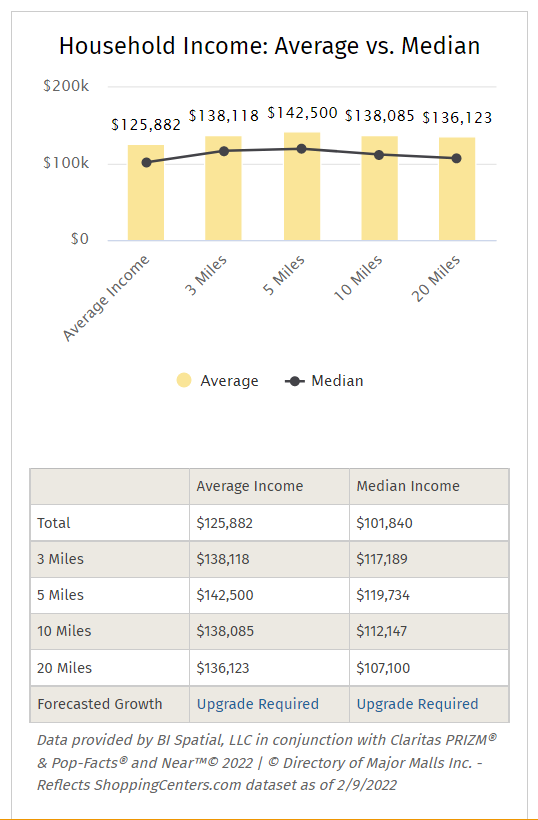
Upgrade to the highest level – MOBILE ANALYTICS – and more attributes are revealed:
Mobile Analytics Tab – expands to include:
- Top 5 Prizm Segments listed by Segment
- 5 yr Forecast: % Owners vs. Renters
- Household Units: % Owners vs Renters
- Household Ages: Avg Age Owners vs Renters
- Household Income Forecasts
- 5 Yr Forecast Avg. Income
- 5 Yr Forecast Med. Income
- 5 Yr Forecast Avg. EBI
- 5 Yr Forecast Med. EBI
- Population by Ethnicity
- Index of Income by Ethnicity
- Education
The variables included may be viewed, searched, exported and are included in the Trend Demographic Report option.
The Primary Market Demographic data is created by cross-referencing the exact location of the individual U.S. shopping center/mall locations using our manually verified geocodes then aggregated to create our enhanced demographics data. These Buffer Zones reflect demographic data for 5, 10 and 20-miles around each individual U.S. shopping center/mall location in the DMM database.
Center Specific Mobile Observation Data created using Trade Areas provide through DMM’s strategic partnership with BI Spatial & Near™, the World’s largest source of mobile data connecting the physical and the digital worlds of more than 1.6 Billion people in 44 Countries.
Top 5 PRIZM® Premier Segments as provided by Claritas, Inc., the industry’s most widely adopted segmentation solution. PRIZM® is built to help marketers find prospects faster and sell smarter by providing rich insights into every household in the U.S. including demographics, lifestyle and media preferences, shopping behaviors, and technology usage.
The ShoppingCenters.com Demographics & Trend data is provided by BI Spatial & Claritas by using the industry’s most robust and accurate demographic and multicultural data to understand market share, opportunity gaps and so much more.
See this page for more insight into these attributes and sources.
If you need to go deeper with more comprehensive data beyond what is available via your access to ShoppingCenters.com, Claritas has an extensive catalog of demographic variables and segmentation data which can be calculated for any location.
Contact us below to discuss your specific demographic, segmentation, and mobile data needs.
Fields marked with * are required
Search FAQ's
Quick Links
- What subscription access options are available on ShoppingCenters.com?
- Definitions for the shopping center subsets
- DMM feature service on Esri ArcGIS
- Quick Tour and Highlights of online access
- Which Shopping Center Contact titles are available?
- Can I export / download data?
- What are the Mobile Traffic, Segmentation and Enhanced Demographics features?
- What are the Retail Chain Store Types?
- Is Historical Shopping Center Data available?
- DMM's Research Methodology
- DMM e-news articles, archives and research
- Technical Support and "HOW TO...?
Still Need Help?
Contact Us


